Streaming Avi Vantage Client Logs to an External Server
Avi Vantage has a built-in indexing and searching service that provides analytics of the application traffic, as well as Avi Vantage system and configuration events. Some customers wish to incorporate the data into a pre-existing log management system (e.g., Splunk, Sumo Logic, or rsyslog/elasticsearch, etc.).
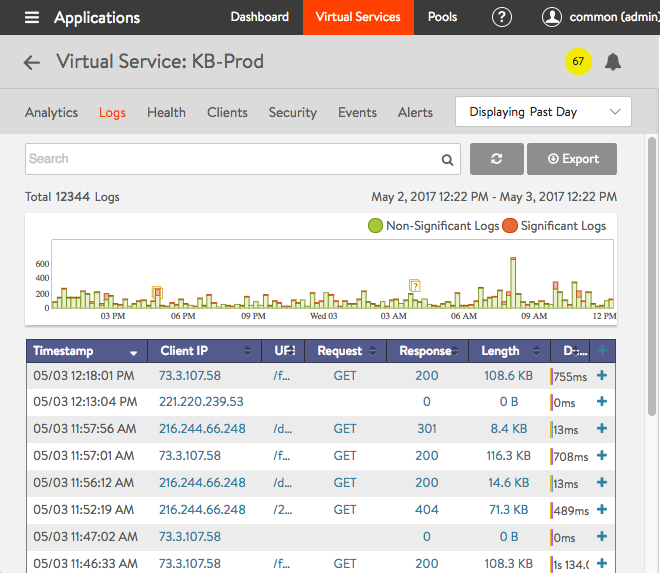
Avi Vantage can stream application logs directly to an external server. (We are referring to the logs typically visible in the Avi UI as shown below.) The logs are streamed as UDP messages directly from the Avi Service Engines. Customers can provide external server information in a new option under Analytics Profile, client_log_streaming_config. Traffic logs of any virtual service that uses such an analytics profile are automatically streamed from the Service Engine(s) on which that VS has been placed. Service Engines use their management interface to connect to a configured external server.
Enabling Application Log Streaming via Avi CLI
Create a new AnalyticsProfile object or edit an existing one and set the following fields under the client_log_streaming_config subsection for streaming application logs:
- external_server: The destination server IP address or hostname. If a hostname is provided, it should be resolvable on Avi Service Engines. Starting with Avi Vantage 18.2.3, multiple servers are supported by furnishing a comma-separated list of IP addresses or host names, for example,
11.11.11.11,23.12.12.4
Optionally, a separate port can be specified for each external server in the list, for example.
11.11.11.11:234,12.12.12.12:343
The subsection below provides a CLI example. - external_server_port: The destination server’s service port. The default for this is 514. Starting with Avi Vantage 18.2.3, if multiple external servers have been identified, the single port number specified here will apply to all but those servers for which an explicit port number has been specified in the external server list.
- log_types_to_send: Type of logs to stream to the external server. Default is logs_all, i.e., send all logs. Other options are:
- logs_significant_only: Only significant logs
- logs_udf_only: Only logs that match any client log filters or rules with logging enabled
- logs_udf_significant: Significant logs as well as logs that match any client log filters or rules with logging enabled
-
max_logs_per_second: Maximum number of logs per second streamed to the external server. By default, 100 logs per second are streamed. Set this to zero(0) to not enforce any limit.
Caution: Please see the notes in “Rate Limiting” section below before making any changes to this variable.
[admin:node-1]: > configure analyticsprofile streaming-profile
[admin:node-1]: analyticsprofile> client_log_streaming_config
[admin:node-1]: analyticsprofile:client_log_streaming_config> external_server 10.10.25.200
[admin:node-1]: analyticsprofile:client_log_streaming_config> log_types_to_send logs_significant_only
[admin:node-1]: analyticsprofile:client_log_streaming_config> max_logs_per_second 20
[admin:node-1]: analyticsprofile:client_log_streaming_config> save
[admin:node-1]: analyticsprofile> save
+-------------------------------------------------+-------------------------------------------------------+
| Field                                           | Value                                                 |
+-------------------------------------------------+-------------------------------------------------------+
 ...
    Many lines intentionally left out
 ...
| client_log_streaming_config                     |                                                       |
|   external_server                               | 10.10.25.200                                          |
|   external_server_port                          | 514                                                   |
|   log_types_to_send                             | LOGS_SIGNIFICANT_ONLY                                 |
|   max_logs_per_second                           | 20                                                    |
+-------------------------------------------------+-------------------------------------------------------+
[admin:node-1]: >
After making the changes above, traffic logs of any virtual service associated with this analytics profile will be streamed to the configured external server(s).
Multiple External Server CLI Configuration Example
[admin:10-10-23-81]: > configure analyticsprofile testprofile
[admin:10-10-23-81]: analyticsprofile> client_log_streaming_config external_server 10.0.0.4,10.0.0.5,10.0.0.6:500
[admin:10-10-23-81]: analyticsprofile> save
+-------------------------------------------------+-------------------------------------------------------+
| Field                                           | Value                                                 |
+-------------------------------------------------+-------------------------------------------------------+
| uuid                                            | analyticsprofile-94517d21-9c61-4255-9325-78954caa1d78 |
| name                                            | testprofile                                           |
| tenant_ref                                      | admin                                                 |
|                                                 |                                                       |
|                                   Many lines intentionally left out                                     |
|                                                 |                                                       |
|                                                 |                                                       |
| client_log_streaming_config                     |                                                       |
|   external_server                               | 10.0.0.4,10.0.0.5,10.0.0.6:500                        |
|   external_server_port                          | 514                                                   |
|   protocol                                      | LOG_STREAMING_PROTOCOL_UDP                            |
|   log_types_to_send                             | LOGS_ALL                                              |
|   max_logs_per_second                           | 100                                                   |
| exclude_dns_policy_drop_as_significant          | False                                                 |
| disable_ondemand_metrics                        | False                                                 |
| ondemand_metrics_idle_timeout                   | 1800 seconds                                          |
| sip_log_depth                                   | 20                                                    |
| healthscore_max_server_limit                    | 20                                                    |
| enable_advanced_analytics                       | True                                                  |
| disable_vs_analytics                            | False                                                 |
+-------------------------------------------------+-------------------------------------------------------+
Enabling Application Log Streaming via Avi UI
Log into the Controller with sufficient administrative privilege to perform the following steps.
- Navigate to Templates -> Profiles -> Analytics.
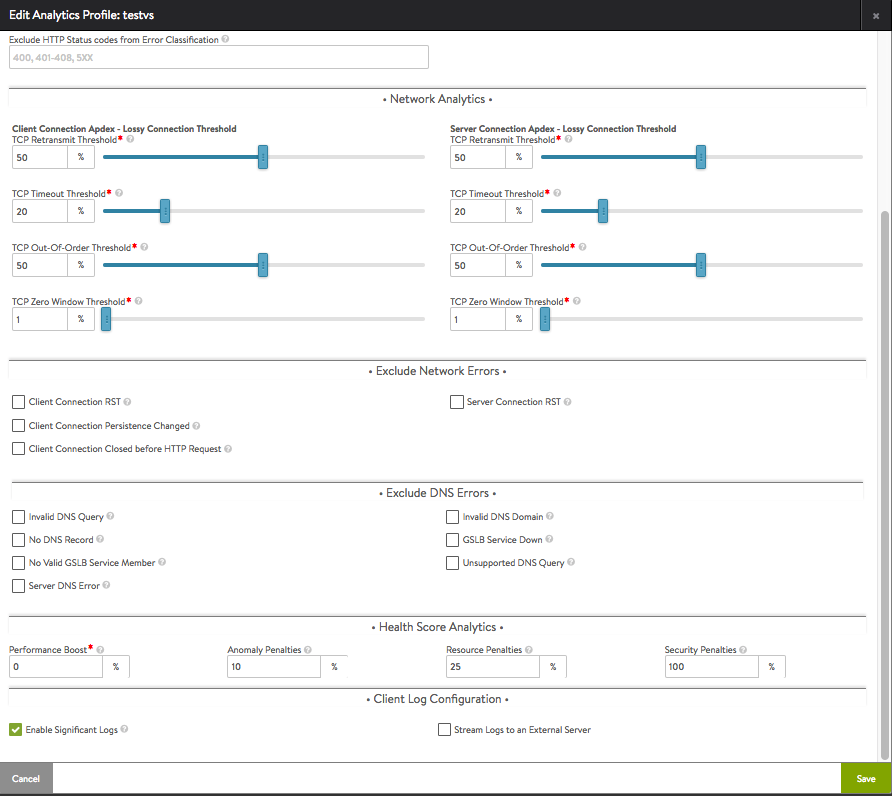
- Create a new or select some pre-existing analytics profile to edit. The relevant settings for log streaming are at the very bottom.
Check the Stream Logs to an External Server option, default for which is OFF.
- Complete the form, and click Save.
- Apply the profile to those virtual services for which log data is to be streamed to the external server.
Rate Limiting
As mentioned above, SEs use their management interface to stream application logs to a configured external server. Since the SE uses the same network interface to synchronize with the Avi Controller, it is necessary to ensure streaming log traffic does not interfere with the management traffic. To that end, Avi Vantage limits the rate of the streaming traffic to some number of log entries streamed per second. The default limit is 100 log entries per second. Though this rate can be changed in the configuration, one should be mindful that streaming logs consumes both SE CPU cycles and bandwidth on the management network.
Formatting of the Streamed Messages
By default, each log is streamed as a JSON-formatted string with no line-breaks.
Example layout: layout201
{"adf": 1, "virtualservice": "virtualservice-4abd93ed-9d89-4ca2-813f-f1706285d7c7", "report_timestamp": "2017-05-01T15:10:08.798592", "service_engine": "10.10.25.204", "vcpu_id": 1, "log_id": 5, "client_ip": "10.90.20.11", "client_src_port": 41392, "client_dest_port": 9000, "client_rtt": 1, "http_version": "1.1", "method": "GET", "uri_path": "/notexist.html", "referer": "www.avinetworks.com", "user_agent": "L7ProxyTest", "xff": "192.168.1.1 17.33.22.107 12.124.13.12 109.32.12.34 234.12.23.67", "host": "10.90.20.64:9000", "persistent_session_id": 3472328296917460336, "response_content_type": "text/html", "request_length": 299, "cacheable": 1, "pool": "pool-16fd2f0c-01db-467a-b673-6faa076b9142", "pool_name": "l7pool1", "server_ip": "10.90.20.61", "server_name": "10.90.20.61", "server_conn_src_ip": "10.90.20.13", "server_dest_port": 80, "server_src_port": 49003, "server_rtt": 16, "server_response_length": 1395, "server_response_code": 404, "server_response_time_first_byte": 1, "server_response_time_last_byte": 1, "response_length": 1397, "response_code": 404, "response_time_first_byte": 1, "response_time_last_byte": 1, "compression": NO_COMPRESSION_CAN_BE_COMPRESSED, "client_insights": NO_INSIGHTS_NOT_SAMPLED_TYPE, "request_headers": 689219, "response_headers": 13, "request_state": AVI_HTTP_REQUEST_STATE_SEND_TO_CLIENT, "significant_log": [ADF_RESPONSE_CODE_4XX], "headers_sent_to_server": "X-Forwarded-For: 10.90.20.11 Host: 10.90.20.64:9000 Accept-Encoding: identity Accept: */* User-Agent: L7ProxyTest referer: www.avinetworks.com Authorization: Basic YXZpdXNlcjphdml1c2Vy ", "headers_received_from_server": "Server: nginx/1.2.1 Date: Mon, 01 May 2017 15:15:24 GMT Content-Type: text/html Content-Length: 1242 Connection: keep-alive ", "server_connection_reused": 1, "vs_ip": "10.90.20.64", "body_updated": NOT_UPDATED, "vs_name": "l7vs1"}
Every log contains a field named report_timestamp, that denotes the time at which that log was generated at the corresponding Service Engine.
The available formatting options available are:
- JSON formatted single-line message as a UDP datagram - Default
- JSON formatted single-line message over a TCP connection
- JSON formatted single-line message over a TCP connection encrypted with TLS - Introduced in 20.1.4
- Syslog (RFC 5424) formatted message as a UDP datagram (log information is still represented in JSON format, but enclosed with Syslog header)
- Syslog (RFC 5424) formatted message over a TCP connection
- Syslog (RFC 5424) formatted message over a TCP connection encrypted with TLS - Introduced in 20.1.4
Currently, the formatting option can only be changed using the CLI.
Selecting Fields for Log Streaming (18.2.5+)
Starting in 18.2.5, users may explicitly select particular fields to be included in streamed logs. This can potentially reduce the size of each streamed log significantly. Note that fields selected must be at the top level of the client logs.
Note: At this time, this feature is supported in the Avi REST API, Avi CLI, but not the Avi UI.
For example, to stream only the client_ip, uri_path, and the response_code fields, either create a new analytics profile or update an existing one and attach it to the virtual service whose logs are be streamed. An Avi CLI example follows. The placesetting X.X.X.X needs to be set to the IP address of the external server.
[admin:10-10-23-81]: > create analyticsprofile selected-fields-profile
[admin:10-10-23-81]: analyticsprofile> client_log_streaming_config
[admin:10-10-23-81]: analyticsprofile:client_log_streaming_config> external_server X.X.X.X
[admin:10-10-23-81]: analyticsprofile:client_log_streaming_config format_config
[admin:10-10-23-81]: analyticsprofile:client_log_streaming_config> format log_streaming_format_json_selected
[admin:10-10-23-81]: analyticsprofile:client_log_streaming_config> included_fields uri_path
[admin:10-10-23-81]: analyticsprofile:client_log_streaming_config> included_fields client_ip
[admin:10-10-23-81]: analyticsprofile:client_log_streaming_config> included_fields response_code
[admin:10-10-23-81]: analyticsprofile:client_log_streaming_config> save
[admin:10-10-23-81]: analyticsprofile> save
[admin:10-10-23-81]: save
After applying this analytics profile, the streamed log would contain information only for the three selected fields. As an example, the information might appear as follows:
{"client_ip":"10.10.22.190","uri_path":"/not_exist","response_code":404}
For a full list of top-level fields , substitute an FQDN or IP address for AVI-CONTROLLER and
- For HTTP applications, point your browser to
https://AVI-CONTROLLER/api/analytics/logs#HTTPLog - For non-HTTP services: point your browser to
https://AVI-CONTROLLER/api/analytics/logs#L4Log
Changing streaming format via Avi CLI
Create a new AnalyticsProfile object or edit an existing one and set the protocol field under the client_log_streaming_config subsection for streaming application logs to one of the following options:
- log_streaming_protocol_udp: Stream logs as UDP datagrams.
- log_streaming_protocol_tcp: Stream logs over a TCP connection.
- log_streaming_protocol_tls: Stream logs over a TCP connection encrypted with TLS. - Introduced in 20.1.4
- log_streaming_protocol_syslog_over_tcp: Stream logs using Syslog protocol (RFC5424) with TCP as the transport protocol.
- log_streaming_protocol_syslog_over_tls: Stream logs using Syslog protocol (RFC5424) with TCP as the transport protocol encrypted with TLS. - Introduced in 20.1.4.
- log_streaming_protocol_syslog_over_udp: Stream logs using Syslog protocol (RFC5424) with UDP as the transport protocol.
    [admin:node-1]: > configure analyticsprofile streaming-profile
    [admin:node-1]: analyticsprofile> client_log_streaming_config
    [admin:node-1]: analyticsprofile:client_log_streaming_config> protocol log_streaming_protocol_syslog_over_tcp
    [admin:node-1]: analyticsprofile:client_log_streaming_config> save
    [admin:node-1]: analyticsprofile> save
Customizable Fields When Streaming in SYSLOG Format
These fields may be customized when streaming in syslog format, either over UDP or TCP:
-
facility— The facility value, as defined in RFC5424. Must be between 0 and 23 inclusive; default is 16. -
significant_log_severity— The severity code, as defined in RFC5424, for significant logs. Must be between 0 and 7 inclusive; default is 4. -
filtered_log_severity— The severity code, as defined in RFC5424, for filtered logs. Must be between 0 and 7 inclusive; default is 5. -
non_significant_log_severity— The severity code, as defined in RFC5424, for non-significant logs. Must be between 0 and 7 inclusive; default is 6. -
hostname— The string to use as the hostname in the syslog messages. This string can contain only printable ASCII characters (hex 21 to hex 7E; no spaces allowed). String length is 255; default is “AviVantage.”
These fields are available under the syslog_config field under client_log_streaming_config.
[admin:node-1]: > configure analyticsprofile streaming-profile
[admin:node-1]: analyticsprofile> client_log_streaming_config
[admin:node-1]: analyticsprofile:client_log_streaming_config> syslog_config
[admin:node-1]: analyticsprofile:client_log_streaming_config:syslog_config> hostname Avi-18.1.3-New
[admin:node-1]: analyticsprofile:client_log_streaming_config:syslog_config> save
[admin:node-1]: analyticsprofile:client_log_streaming_config> save
[admin:node-1]: analyticsprofile> save
Streaming Client Logs Directly Without Writing Data to Local or Network Disk
By default, any log (significant, filtered, or non-significant) collected on Services Engines is saved to disk so that the Avi Controller can retrieve them and process them on demand. However, when all logs are streamed from SEs to an external system and no processing by the Avi Controller is desired, saving all logs to disk unnecessarily wastes IO bandwidth. As of Avi Vantage 18.1.2, local- or network-disk logging can be turned off by using either the Avi UI or Avi CLI, as indicated below.
Using the Avi UI
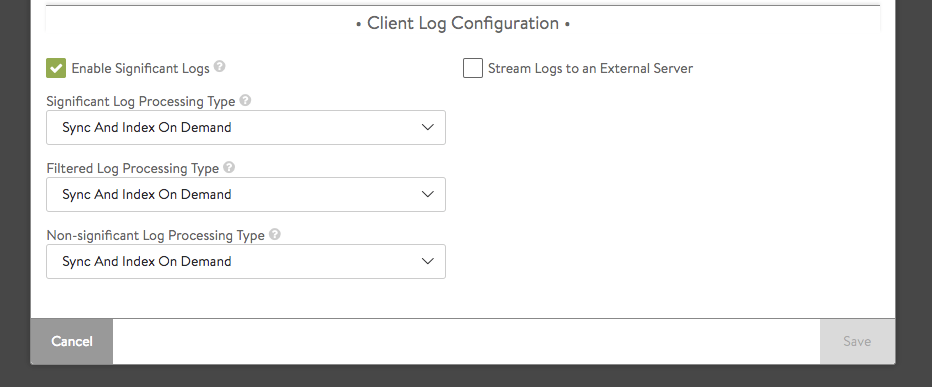
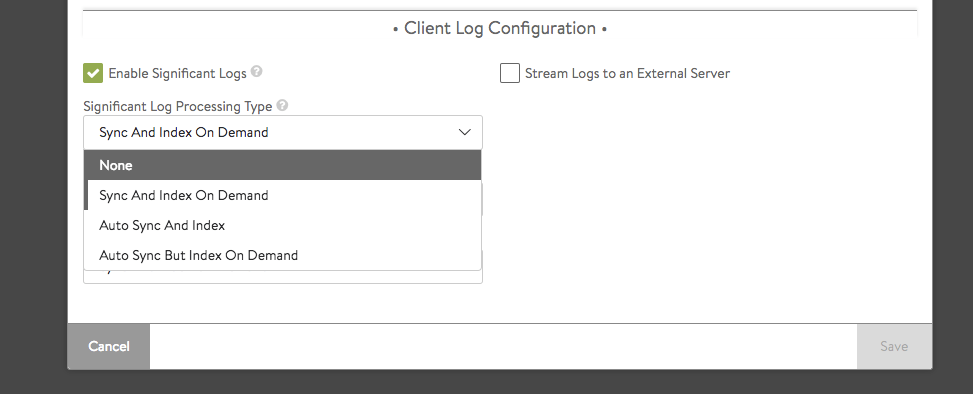
Depicted below are two views of the Client Log Configuration section of the Application Profile editor. In addition to selecting the Stream Logs to an External Server checkbox, the user can independently select the behavior desired for significant, filtered, and non-significant logs.
Select None to turn off writing log data to local or network disk.
Using the Avi CLI
Parameters under the client_log_config field in the Analytics Profile need to be set to LOG_PROCESSING_NONE. Those parameters are significant_log_processing, filtered_log_processing, and non_significant_log_processing.
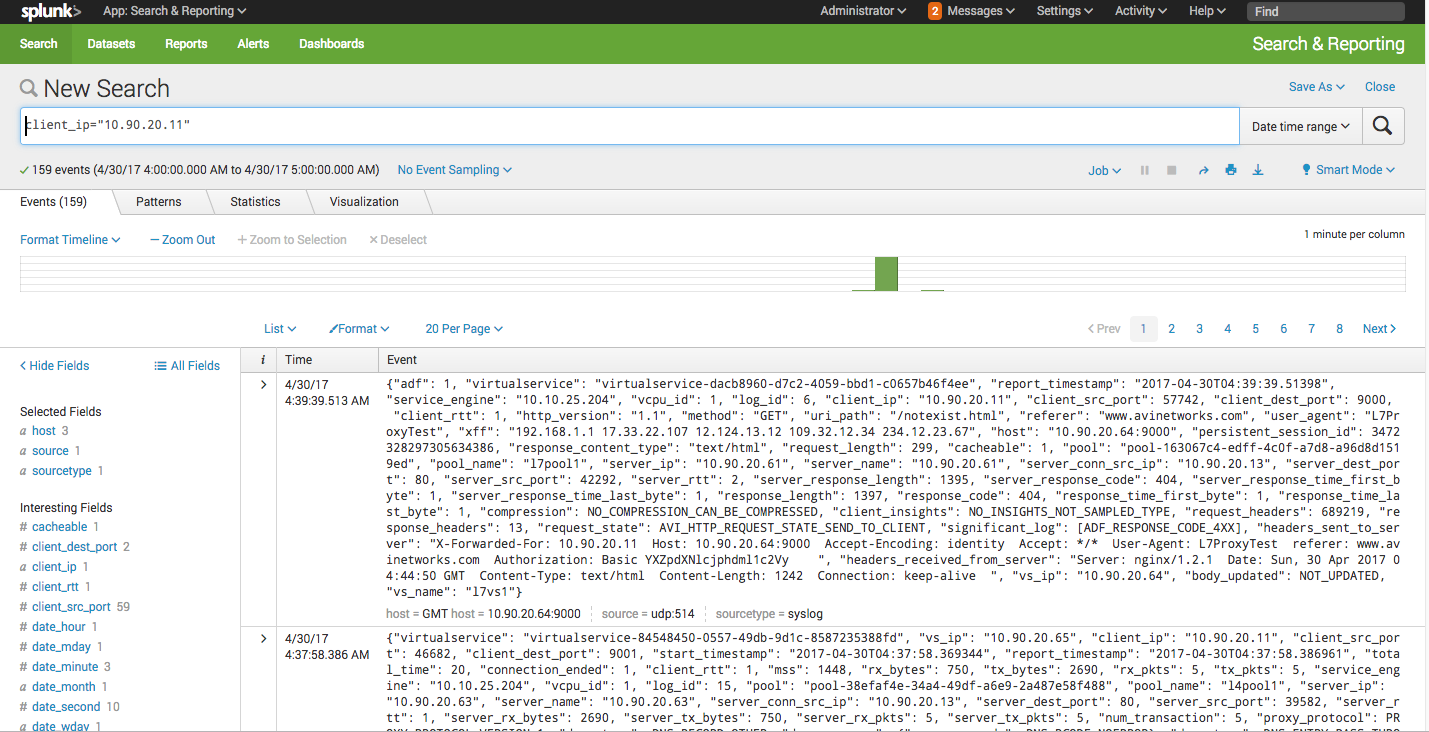
Splunk as the External Server
Splunk can be configured to receive UDP messages on port 514. Please refer to the documentation.
./splunk add udp 514 -sourcetype syslog We recommend using syslog as the source type to properly interpret the single-line JSON string streamed for each log.
By default, Splunk would timestamp each received log with a timestamp corresponding to the time at which Splunk received that log. To force Splunk to use the report_timestamp in the log content as the timestamp for the log, please set the following configuration in props.conf :
[syslog]
TIME_PREFIX = \"report_timestamp\":\ \"
TIME_FORMAT = %Y-%m-%dT%H:%M:%S.%5N
Please refer to the documentation for more details.
Screenshot from a Splunk Server:

