Packet Capture
Overview
Packet capture in Avi Vantage runs a TCPdump for the designated virtual service or Service Engine and provides complete visibility into the packet transmission.
Virtual services may be on a single Service Engine (SE) or scaled out across multiple active SEs. The traffic captures will be automatically run on all SEs actively handling traffic for a virtual service. After the capture is completed, the SE will forward the pcap file to the Controller, which aggregates and sorts the client and server data into a single file.
Note: It is highly recommended to set a limit for the capture. This limit may either be the maximum number of packets to receive or the duration of the capture, in minutes. After reaching the limit, the capture will be terminated and sent to the Controller.
The following are the traffic capture feature list:
Capturing Virtual Service Traffic using CLI/ UI
Capturing Virtual Service Traffic using UI
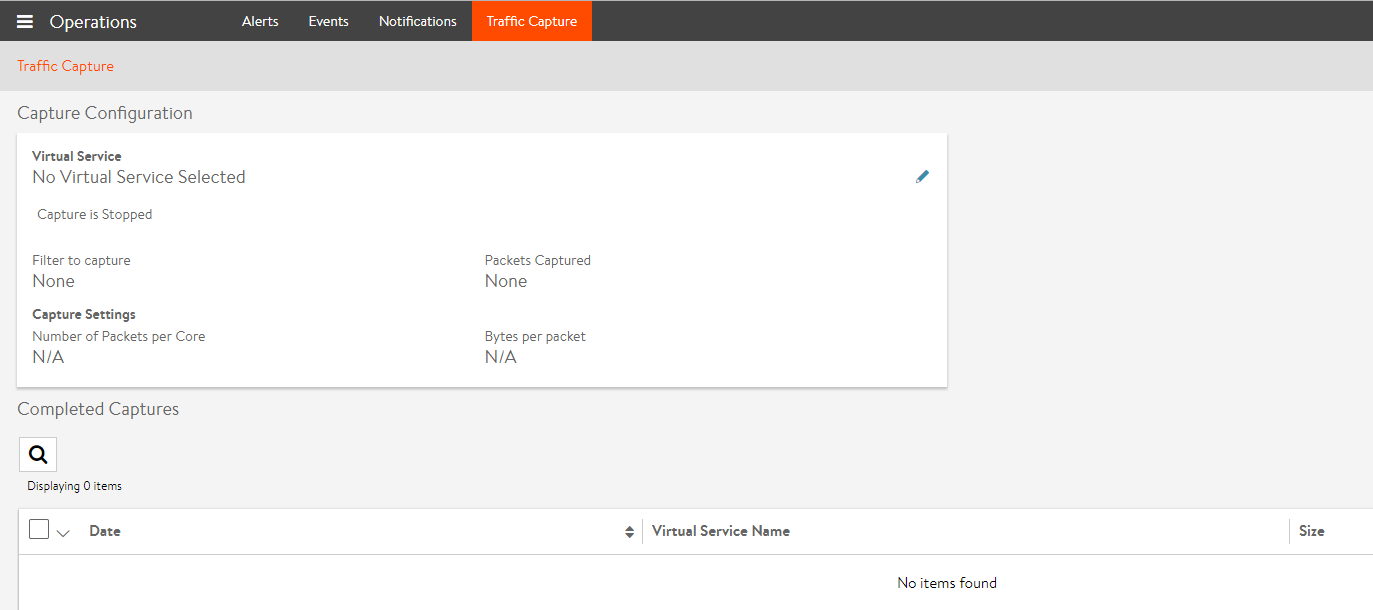
Navigate to Operations > Traffic Capture. The Capture Configuration section displays the parameters defined for captures currently in progress.
Click on the edit icon to start a new capture.
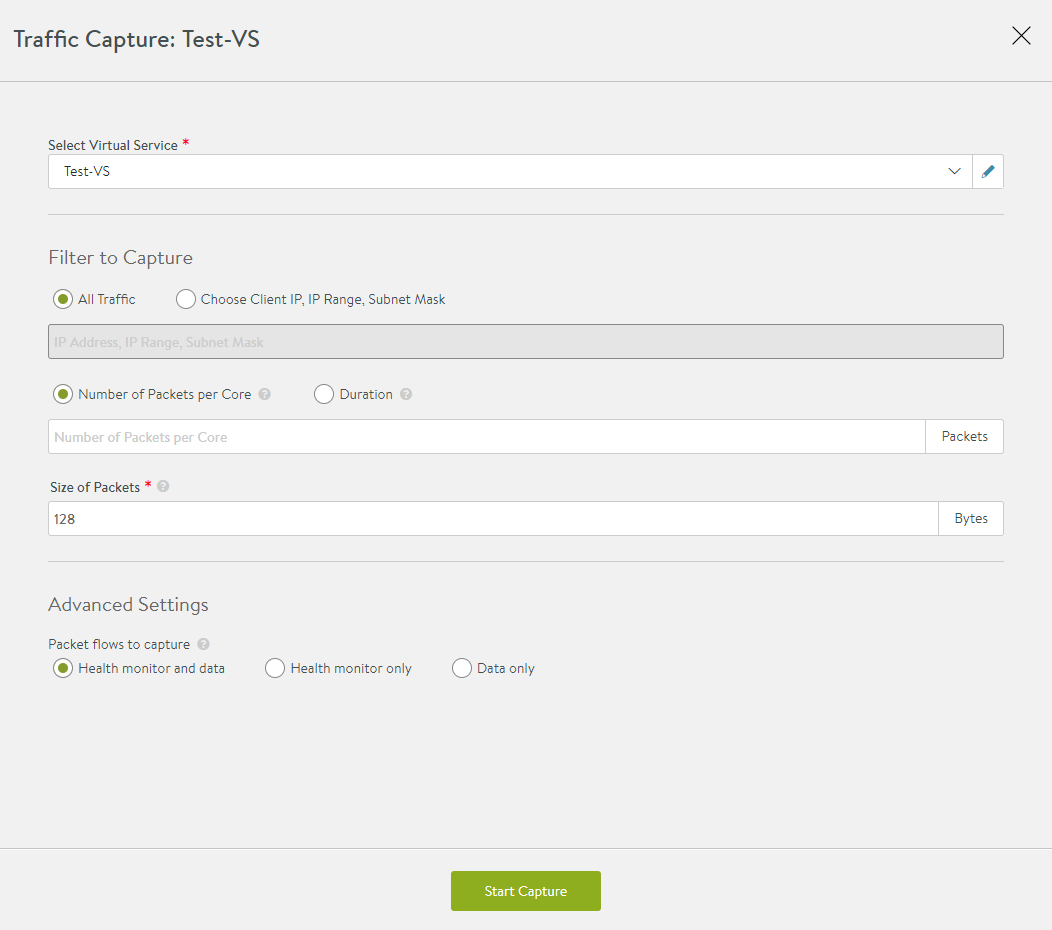
- Select Virtual Service – From the drop-down list, select the virtual service you want to capture the traffic for. This capture includes both the client-to-SE and SE-to-server side of the connection. The traffic will be captured on all SEs handling traffic for that virtual service.
Filter to Capture
- All Traffic – Select this option to capture all traffic.
- Choose Client IP, IP Range, Subnet Mask – Select this option to capture traffic only for the specified IP address, list or range of IP addresses, or subnet. The IP addresses can be client or server addresses.
- To specify a list, use a space between each address. For example: 10.1.1.1 10.1.1.99 192.168.8.200
- To specify a range, use the following format: 10.1.1.1-10.1.1.255
- To specify a subnet, use the following format: 10.1.1.1/24
- Number of Packets per Core – Select this option and specify the maximum number of packets to capture in the core.
-
Duration – Select this option and specify the time in minutes to run the capture.
- Size of Packets – Specify the size of the packet, in bytes, to be captured. This is similar to the
snaplenoption in TCPdump. To capture the entire packet, enter 0.
Advanced Settings
Select one of the following options to control the captures for health monitor flows:
- Health monitor and data
- Health monitor only
- Data only
Note: Enabling session key capture is documented in this article
When a capture is started, the Capture Configuration page displays the progress of the capture.
Completed Captures
After the capture is completed, the Controller collates data from multiple SEs and formats the data into a pcap file. These captures are then displayed in the Completed Captures section of the UI. The table displays the Date, Virtual Service Name, and Size of Packets captured. You can export the captures by downloading them in the pcap format, using the icon available at the far right column of the table. The capture file can be viewed using any common traffic capture utilities, such as, Wireshark.
Capturing Virtual Service Traffic using CLI
To capture packets using the Avi CLI, log into the shell prompt and enter the packet capture sub-mode for the desired virtual service:
debug virtualservice Test-virtual service
Updating an existing object. Currently, the object is:
+-------+-----------------------+
| Field |        Value          |
+-------+-----------------------+
| uuid  | virtualservice-0-1    |
| name  | Test-virtual service  |
+-------+-----------------------+
Parameters may be defined for the packet capture. By default, the capture is performed within the context of the selected virtual service. It is also performed on all Avi SEs that are handling the virtual service traffic and includes the packets from the client and server side of the SE.
| Parameter | Definition |
|---|---|
capture_params duration |
Time, in minutes. Default is unlimited |
capture_params num_pkts |
Maximum number of packets to collect. Default is unlimited |
capture_params pkt_size |
Packet size, or snap length, to capture. Default is unlimited |
debug_ip addrs |
IPv4 address format |
debug_ip prefixes |
IPv4 prefix format <x.x.x.x/x> |
debug_virtual service_hm_include |
Include health monitor packets in the capture |
debug_virtual service_hm_none |
Omit health monitor packets from the capture (the default) |
debug_virtual service_hm_only |
Capture only health monitor packets |
The debug_ip command enters a sub-mode. This allows multiple IP addresses or IP subnets to be entered. Omit the debug_ip option for subsequent entries. Save to commit the desired IPs and return to the previous menu.
Note: By default, no maximum packets or duration of time to be captured are defined. It is recommended to include a maximum packet capture as shown in the following example. Without a limit, the capture will run until the Avi SE drive is full, potentially disrupting service.
Specify parameters, including the maximum number of packets to capture:
debugvirtualservice> capture_params num_pkts 1000
debugvirtualservice> debug_ip addrs 10.10.10.10
debugvirtualservice:debug_ip> save
Begin capturing based on the previously configured parameters:
debugvirtualservice> capture
debugvirtualservice> save
+----------------+--------------------+
| Field          |          Value     |
+----------------+--------------------+
| uuid           | virtualservice-0-1 |
| name           | Test-VS            |
| debug_ip       |                    |
| addrs[1]       | 10.10.10.10        |
| capture        | True               |
| capture_params |                    |
| duration       | 0 mins             |
| num_pkts       | 1000               |
+----------------+--------------------+
Re-enter the packet capture sub-mode and stop an ongoing packet capture:
debug virtualservice Test-virtual service
debugvirtualservice> no capture
debugvirtualservice> save
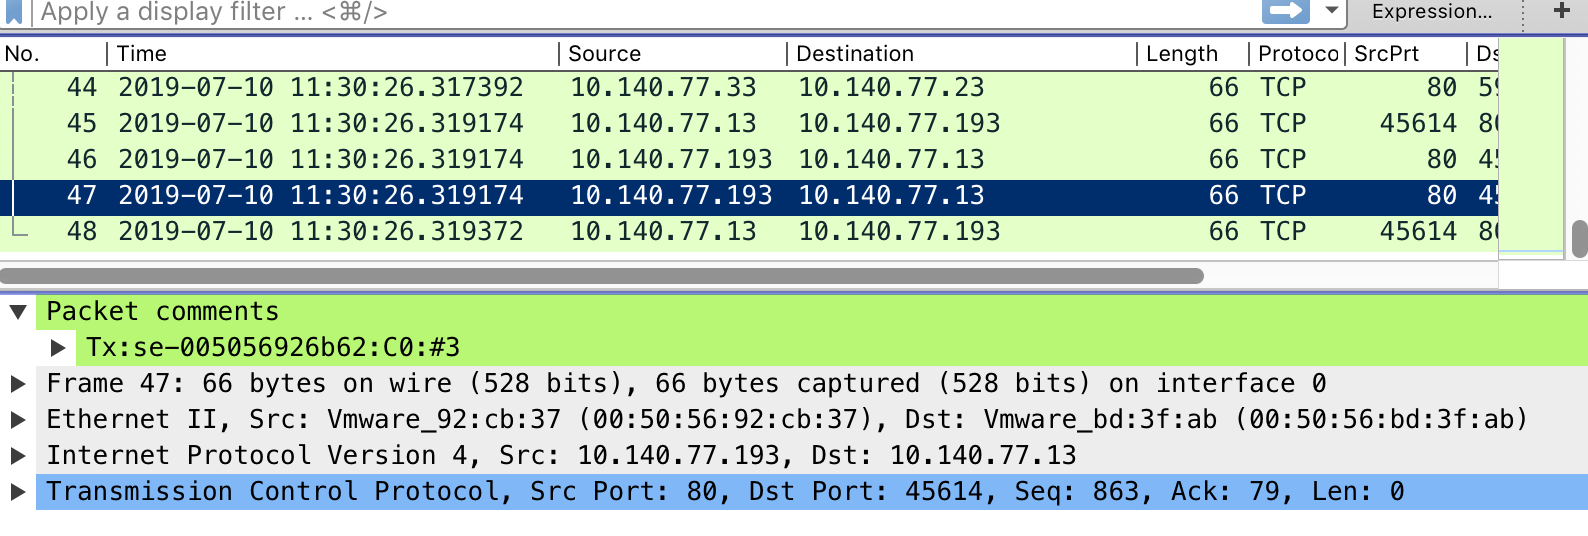
Capturing Virtual Service Packet in PcapNg Format
The virtual service packet can be captured in PcapNg format.
- Every packet will present the direction of transmission, se-uuid and core number that processed this packet.
-
The front-end and back-end flows are tied up with a unique flow ID. You can co-relate the front-end and back-end connections in the packet captures without going back to AVI connection/app logs.
Note: The flow ID may not be present for all packets in the flow.
To turn off this feature and fallback to pcap, the following command can be used:
debug virtualservice <>
capture_params
no pcap_ng
The following is the sample of the output as viewed on Wireshark:
Exporting Packet Capture for Virtual Service Pcaps
Export the packet capture to a remote system that can view it via a tool such as TCPdump or Wireshark:
show debug virtualservice Test-virtual service capture
Please specify the destination directory: /tmp
Downloaded the attachment to /tmp/virtual service_virtualservice.20141205_192033.pcap
bash
scp /tmp/virtual service_virtualservice.192033.pcap user@10.1.1.1:/tmpCapturing Service Engine Traffic using CLI
Starting with Avi Vantage release 18.2.1, packet capture is available for Avi Service Engines as well.
Login to the shell using Avi CLI and then enter into the packet capture sub-mode for the Avi Service Engine:
To start packet capture for an Avi SE, use the debug serviceengine <SE IP address> command.
[admin:cntrl1]: > debug serviceengine 10.10.22.107
Updating an existing object. Currently, the object is:
+------------+--------------------------+
| Field      | Value                    |
+------------+--------------------------+
| uuid       | se-10.10.22.107-avitag-1 |
| name       | 10.10.22.107             |
| tenant_ref | admin                    |
+------------+--------------------------+
SE Pcap Types
To start packet capture for an Avi SE, use the debug serviceengine <SE IP address> command.
Various types of SE Pcaps:
| SE Pcaps | Description | Minimum Supported Version |
|---|---|---|
| SE level PCAP | Captures every ingress and egress packets received/ sent by a given SE. File format: se_core_<core_num>.pcapSE debug flag: debug_pcap_rx, debug_pcap_tx |
17.2.12 |
| Dropped PCAP | Packets dropped by SE are captured and stored into pcap file. Reason for drop is stamped on comment section of the packet. File format: se_dropped_<core_num>.pcapngNote: Few dropped packets might not be present in this capture file but this gives some level of visibility. SE debug flag: debug_pcap_drop |
18.2.5 |
| IPC PCAP | IPC messages exchanged between SE’s are captured. Type of IPC message is stamped on comment section of the packet. File format: se_ipc_<core_num>.pcapngSE debug flag: debug_pcap_se_ipc |
18.2.5 |
| DOS PCAP | Dos packets are captured. File format: se_dos_<core_num>.pcapSE debug flag: debug_pcap_dos |
17.2.12 |
| NAT PCAP | Captures all the NATed traffic on a given SE. Packet comments help in determining if a flow is external/internal. File format: se_nat_<core_num>.pcapngSE debug flag: debug_pcap_nat |
21.1.1 |
| ROUTING PCAP | Capture all the packets that are routed by a given SE. File format: se_routing_<core_num>.pcapngSE debug flag: debug_pcap_routing |
21.1.1 |
Note: Capture knob under debug serviceengine <SE IP address> command will help in enabling all types of captures at once. Since, this starts all the SE captures, disk memory maybe consumed.
Configurable Parameters for VS and PCAP
Filtering based on IP Address
Run the debug_ip addrs <IP address for filter> command from the debugserviceengine mode to filter the SE packet capture for the specific IP address.
 [admin:cntrl1]: debugserviceengine> debug_ip addrs 10.10.10.10
 [admin:cntrl1]: debugserviceengine:debug_ip>
 [admin:cntrl1]: debugserviceengine:debug_ip> save
 [admin:cntrl1]: debugserviceengine> where
 Tenant: admin
 +----------------+--------------------------+
 | Field          | Value                    |
 +----------------+--------------------------+
 | uuid           | se-10.10.22.107-avitag-1 |
 | name           | 10.10.22.107             |
 | debug_ip       |                          |
 |   addrs[1]     | 10.10.10.10              |
 | tenant_ref     | admin                    |
 +----------------+--------------------------+
Filtering based on Capture Duration
Run the capture_params duration <duration in minutes> command from the debugserviceengine mode to capture packets for the specified duration.
 [admin:cntrl1]: debugserviceengine> capture_params duration 10
 [admin:cntrl1]: debugserviceengine> where
 Tenant: admin
 +----------------+--------------------------+
 | Field          | Value                    |
 +----------------+--------------------------+
 | uuid           | se-10.10.22.107-avitag-1 |
 | name           | 10.10.22.107             |
 | debug_ip       |                          |
 |   addrs[1]     | 10.10.10.10              |
 | capture_params |                          |
 |   duration     | 10 min                   |
 | tenant_ref     | admin                    |
 +----------------+--------------------------+
Filtering based on Capture Packet Size
Run the capture_params pkt_size <packet size in bytes> command from the debugserviceengine mode to capture traffic of the desired packet size.
[admin:cntrl1]: debugserviceengine> capture_params pkt_size 0
[admin:cntrl1]: debugserviceengine> where
Tenant: admin
+----------------+--------------------------+
| Field          | Value                    |
+----------------+--------------------------+
| uuid           | se-10.10.22.107-avitag-1 |
| name           | 10.10.22.107             |
| debug_ip       |                          |
|   addrs[1]     | 10.10.10.10              |
| capture_params |                          |
|   pkt_size     | 0 bytes                  |
|   duration     | 10 min                   |
| tenant_ref     | admin                    |
+----------------+--------------------------+
[admin:cntrl1]: debugserviceengine> save
[admin:cntrl1]:
The above packet filter captures traffic for the Service Engine 10.10.22.107 with the IP address 10.10.10.10 for a duration of 10 minutes with packet size 0.
To stop the ongoing packet capture, re-enter the packet capture sub-mode and run no capture command.
[admin:cntrl1]: debug service engine 10.10.22.107
[admin:cntrl1]: debugserviceengine> no capture
[admin:cntrl1]: debugserviceengine> save
For analysis, export the packet capture to a remote system and use tools such as TCPdump or Wireshark for further analysis. For more information on exporting packet capture, refer to Exporting Packet Capture for Virtual Service Pcaps section of this article.
Configurable Size for both Virtual Service and SE Pcaps
The following are the configurable size for both virtual service and SE Pcaps:
-
The maximum Pcap file size per SE can be specified in this section. Each core gets configured (maximum size)/(total number of cores).
-
absolute_size: The maximum pcap file size in MegaBytes. -
percentage_size: The percentage of free disk space available in Avi partition. The valid range is 0-75%. The free size is instantaneous free size at the time of configuration. This should be used with caution. -
Set
absolute_sizeandpercentage_sizeto 0 to use Avi’s default maximum allowed Pcap size (100MB) per core. -
The maximum of
absolute_sizeandpercentage_sizewill be considered as maximum Pcap file.
[admin:ctrl]: > debug serviceengine 10.10.100.10
[admin:ctrl]: debugserviceengine> capture_params
[admin:ctrl]: debugserviceengine:capture_params> capture_file_size
[admin:ctrl]: debugserviceengine:capture_params:capture_file_size> absolute_size 500
[admin:ctrl]: debugserviceengine:capture_params:capture_file_size> save
[admin:ctrl]: debugserviceengine:capture_params> save
[admin:ctrl]: debugserviceengine> save
Notes:
- You need to observe caution while using
percentage_sizevalue. It is the instantaneous free size which is taken into consideration. - With virtual service and SE Pcap configured with
percentage_size, the cumulative number of these sizes during configuration is not supported. This could lead to disk space problems. Excessive enabling of debugs could also aggravate the same.
SE Pcap File Rotation
The following are the properties of SE level Pcap file rotation:
-
file_countunder capture param knob can be used to turn on file rotation of the Pcap file. -
file_countgreater than one indicates that the file rotate is on. -
With the file rotate on, the latest
configured_pcap_file_sizeof data will be present in the captured file. -
With the file rotate off,
configured_pcap_file_sizeof data from the time of capture start will be captured.
The following is the CLI command under SE Pcap file rotation:
[admin:ctrl]: > debug serviceengine 10.19.108.10
[admin:ctrl]: debugserviceengine> capture_params
[admin:ctrl]: debugserviceengine:capture_params> file_count 2
[admin:ctrl]: debugserviceengine:capture_params> save
[admin:ctrl]: debugserviceengine> save
Downloading Packet Capture for Service Engine Pcaps
You can gather SE Pcaps from the Controller from /var/lib/avi/se-pcap path.
You can use the following code to download packet capture for SE Pcaps:
scp /var/lib/avi/se-pcap/se*.pcap user@10.1.1.1:/tmp Document Revision History
| Date | Change Summary |
|---|---|
| August 04, 2021 | Re-arranged all the sections |


