Monitoring iWAF
This document discusses options available on Avi Vantage to monitor intelligent web application firewall (iWAF) under the following sections:
WAF Logs
When a WAF policy is attached to a virtual service, specific WAF logs are generated. To view the log files, navigate to Applications > Virtual Services. Click on the virtual service mapped to the WAF policy, and navigate to Logs.
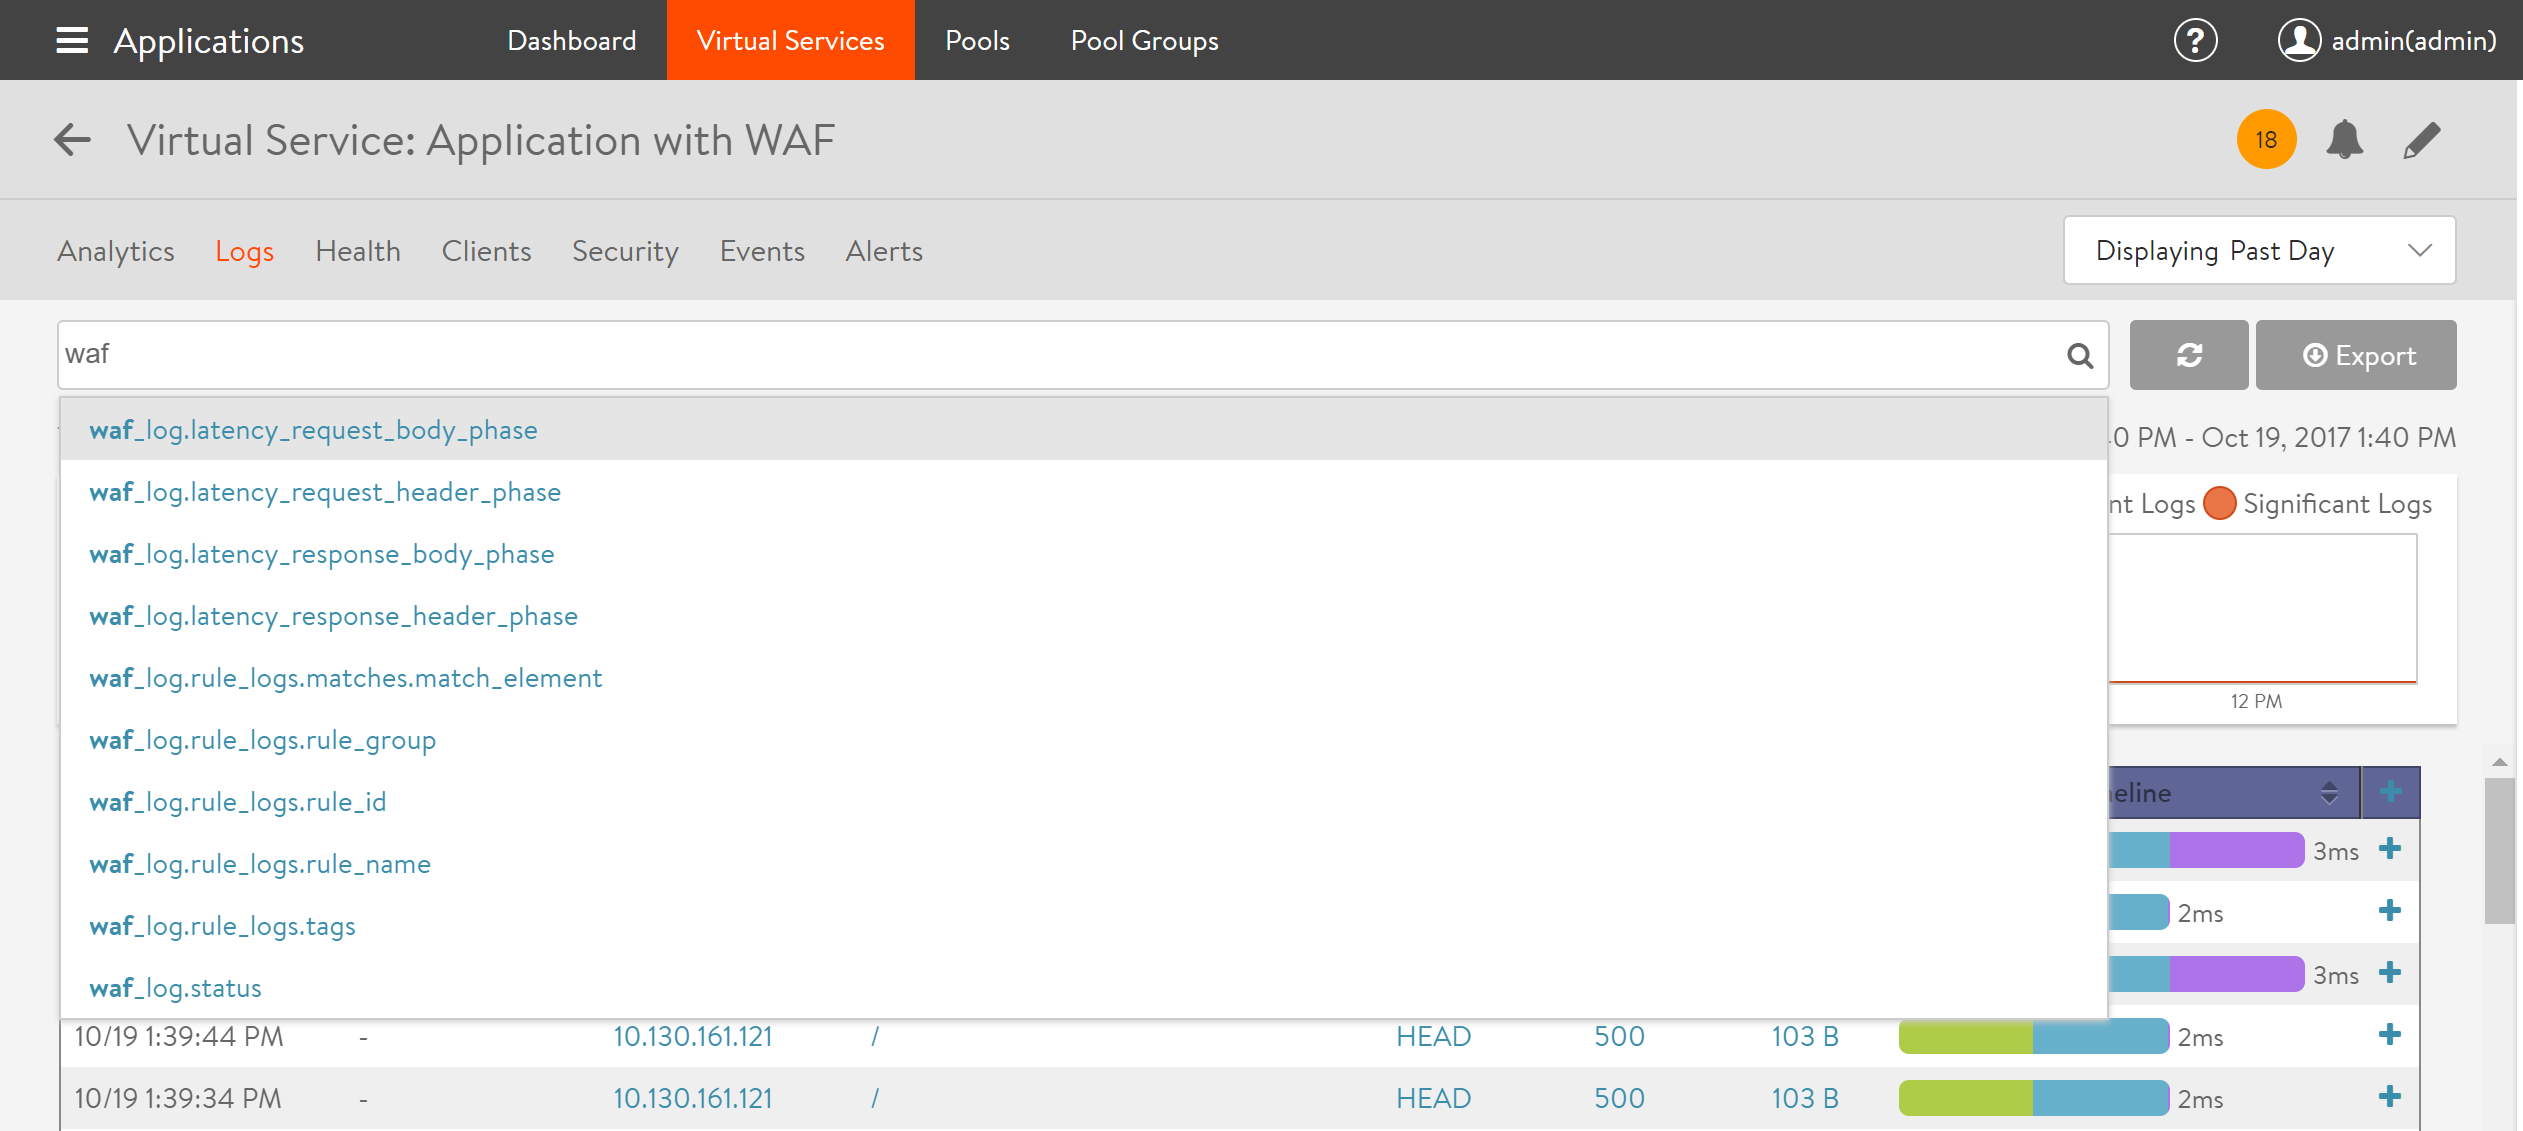
The logs can be filtered to view specific WAF entries. Type WAF on the search bar to populate the available options.
These filters can be used for WAF Log Analytics as well.
Analyzing WAF logs
The following are the fields in a WAF log entry:
- Timestamp: Time of capturing the log.
- WAF: Result of WAF evaluation. For more details, refer to the WAF Status section.
- Client IP: IP address of the client.
- URI: URL of the evaluated traffic.
- Request: Request type
- Response: Response code.
- Length: Size of the response body.
- Duration/Timeline: Duration of the traffic.
WAF Status
This column in the WAF log entry refers to the result of WAF evaluation. The following are the possible outcomes:
- REJECTED: Policy is in enforcement mode and the request was rejected.
- FLAGGED: Policy is in detection only mode and the request was logged, but not rejected.
- PASSED: Request passed the WAF policy without any match.
- Not applicable: The request was not evaluated by WAF.
- BYPASSED: When the request matches with the Allowlist and the Allowlist handles the request.
Starting with NSX Advanced Load Balancer version 21.1.3, log recommendations are introduced to help you remediate false positives, if any. These recommendations correspond to each REJECTED or FLAGGED or log entry.
Note: The system generates recommendations that suggest what you can do to mitigate a false positive. However, it is entirely within your discretion to decide if a log entry represents a false positive.
Detailed log information
Clicking on the + sign at the end of each log entry will expand the panel to provide more details.
- Significance: Indicates WAF policy match.
Note: This is the first indicator of a matched WAF policy and does not indicate if the request was rejected or not.
- WAF response time: Displays the execution time for all four WAF evaluation phases.
- WAF Hits: Displays the rules that were matched. All rules that were matched will have an entry consisting of the following fields:
- Group name
- Rule name
- Rule ID
- Rule message
- Part of the request or response that was matched, along with the offending string
- Match phase
- All tags assigned to the rule
- Add Exceptions: Under the WAF Hits section, click on + Add Exceptions, to create an exception for a false-positive remediation.
Exceptions can be created either at a group or a rule level. The exceptions created will be activated immediately.
WAF Log Analytics
Navigate to Applications > Virtual Services. Click on the virtual service mapped to the WAF policy, navigate to Logs, and click on the right side panel to access Log Analytics.
The Log Analytics tab provides an option for WAF analytics under the following sections:
- WAF Tags
- WAF Rules
- WAF Groups
- WAF Latency
Each section provides an insight into the currently filtered traffic. Analytics can be generated based on the time frame chosen, such as Displaying Past Week, Displaying Past 6 Hours, etc. The new WAF log analytics items can now be used in conjunction with the already existent analytics.
The following screenshot shows a sample of logs displayed on choosing FLAGGED WAF status filter along with CRS_949_Anomaly_Evaluations rule group under WAF Groups in the Analytics tab.
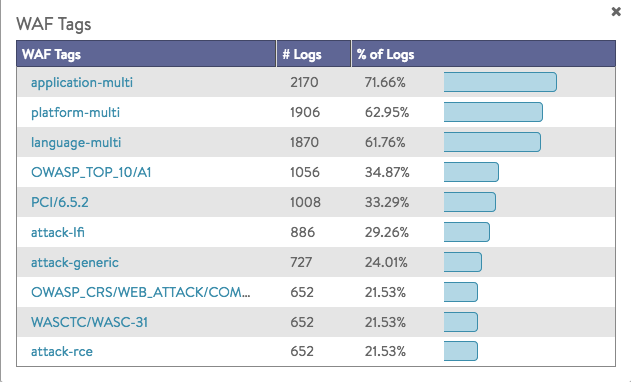
WAF Tags
Overview of the tags that were hit during the selected time frame.
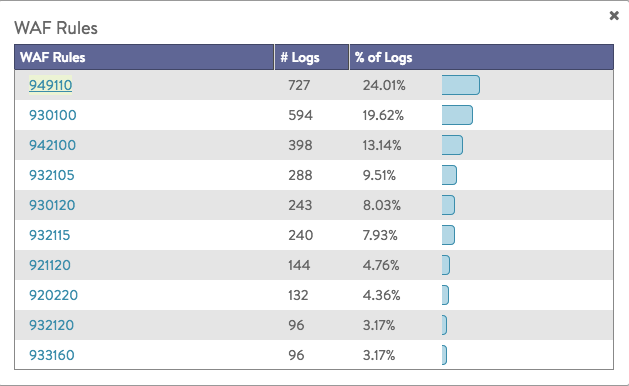
WAF Rules
Overview of the rules that were hit during the selected time frame.
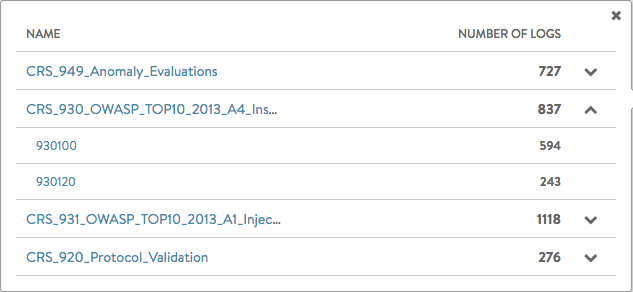
WAF Groups
Overview of the groups that were hit during the selected time frame. Groups can be expanded to show the distribution by rule.
WAF Latency
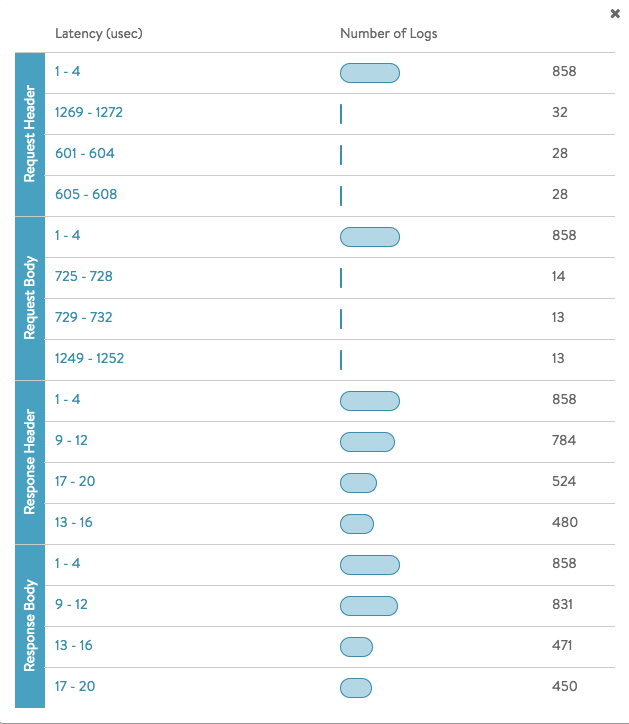
Summary of the latency in microsecond for the log entries in a given time frame.
WAF Metrics
To view WAF related metrics, navigate to Applications > Virtual Services. Click on the virtual service mapped to the WAF policy, and navigate to WAF.
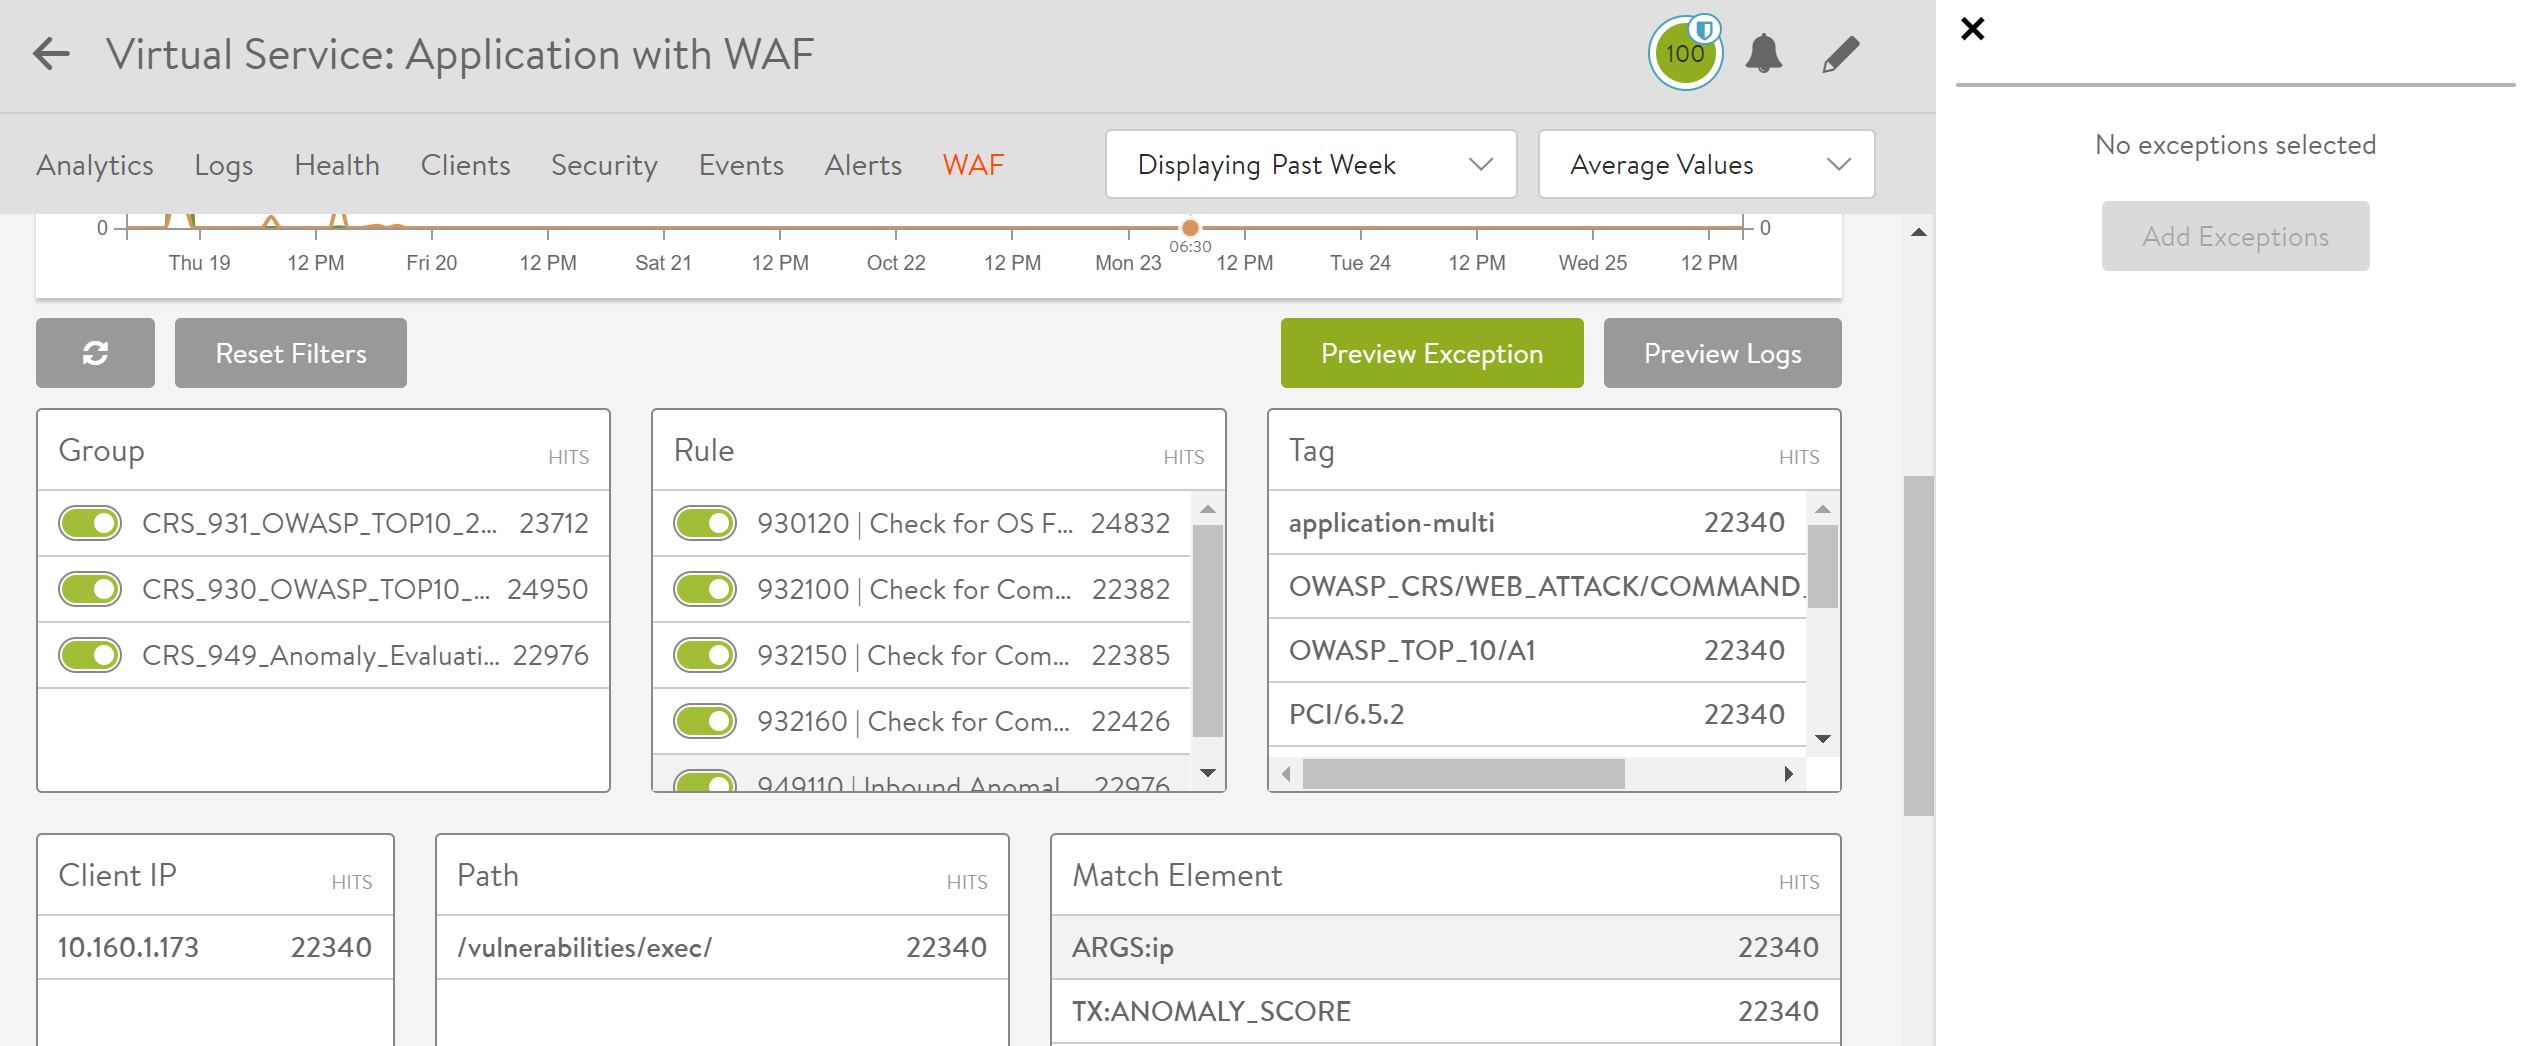
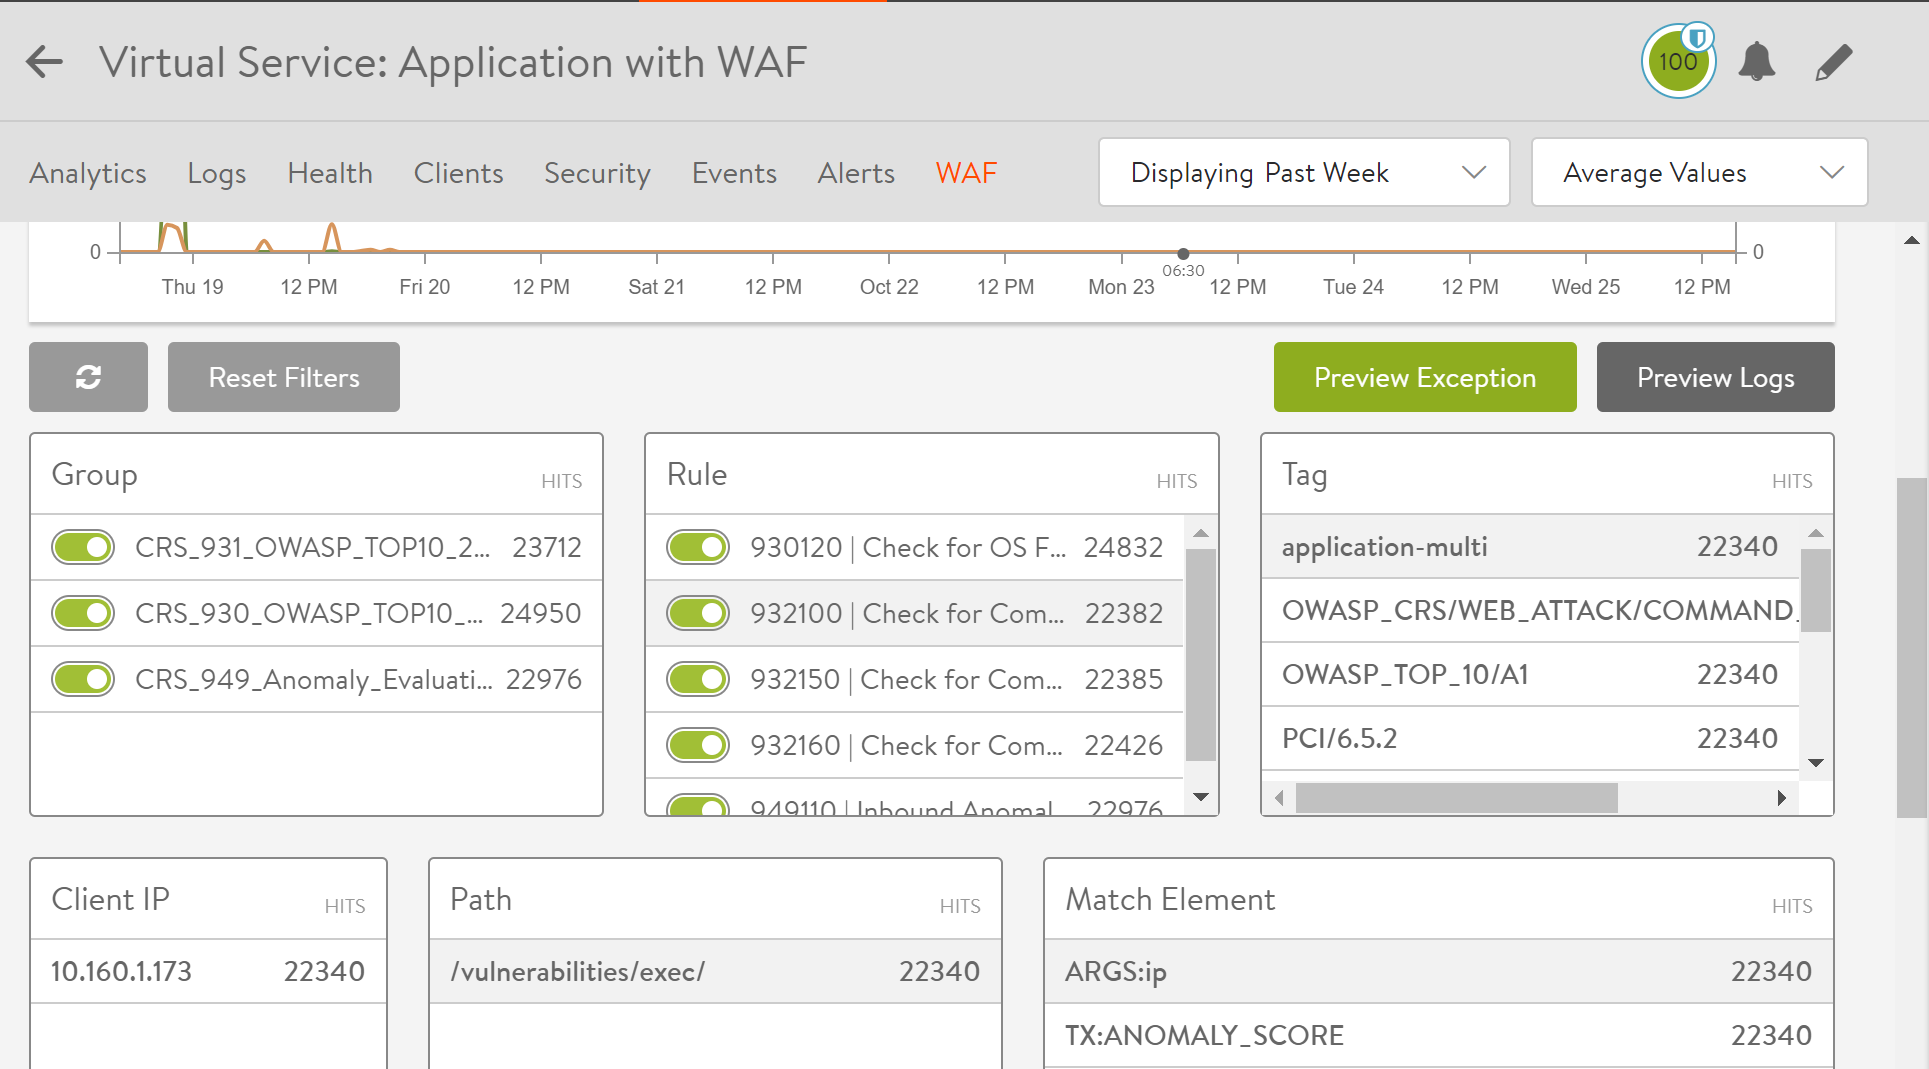
The chart in this tab displays WAF rule hits against the chosen time frame. This helps analyze denied requests and their corresponding trigger.
The following fields show specific hit counts for each listed element:
- Group
- Rule
- Tag
- Client IP
- Path
- Match Element
All elements in each field are displayed with the corresponding hit count. On discovering a false positive, any rule or group can be disabled, by using the toggle button.
You can click on any element in each field to create a specific filter. Then, the field Popular Combinations displays the known combinations and their hit counts related to the chosen filter. The filter can be reset by clicking on Reset filters.
Preview Exceptions
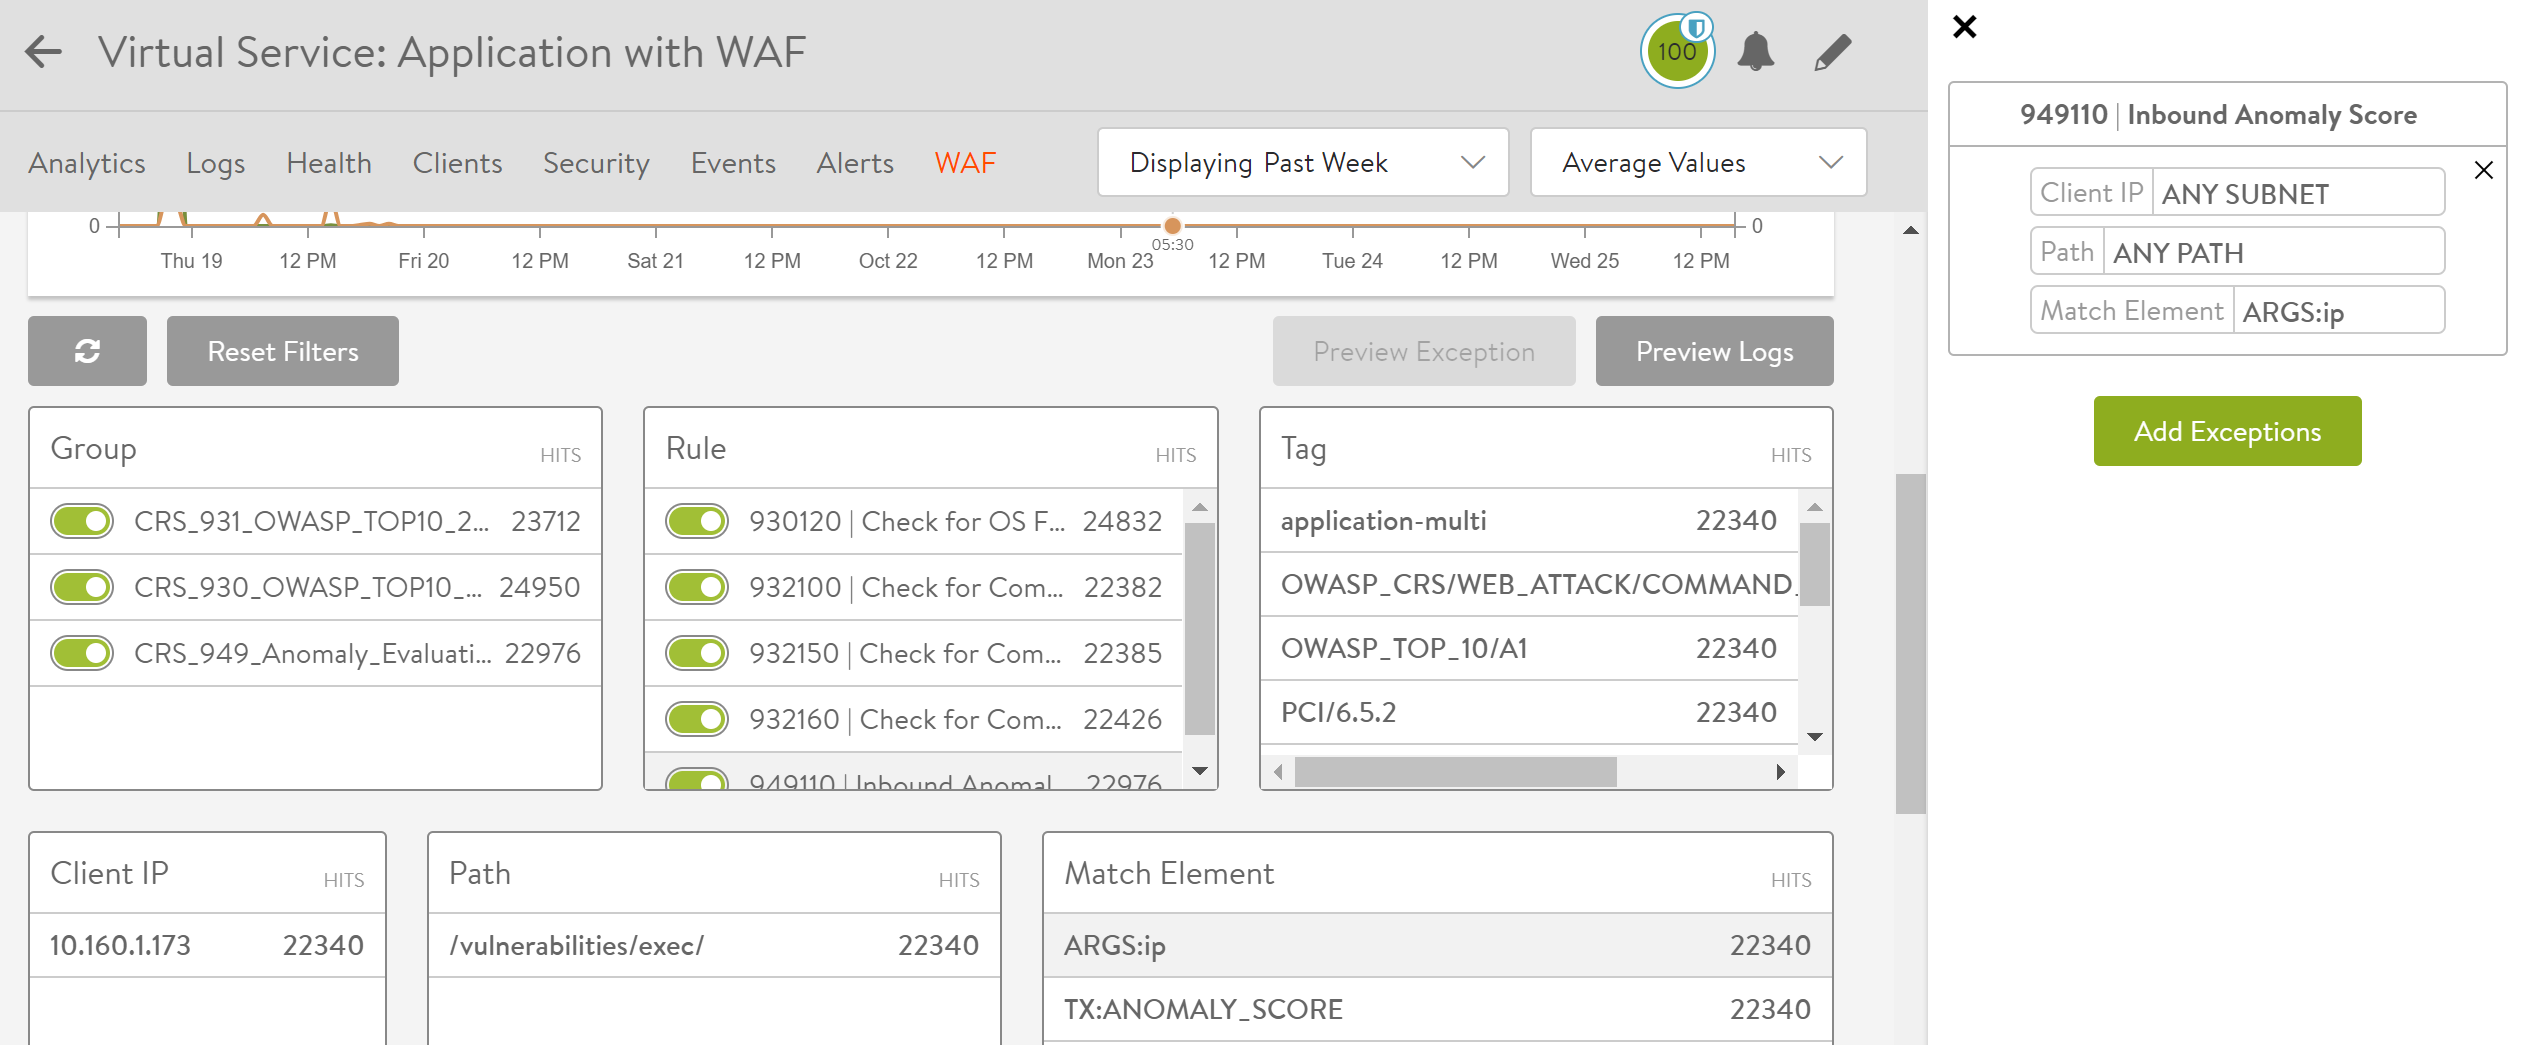
On choosing a specific filter under Client IP, Path, and Match Element, you can add an exception for the selected combination.
Click on Preview Exception to view the exception on the right-side pane. To add this exception, click on the Add Exceptions icon. The policy will be updated immediately.
Note: For previewing and creating exceptions, ensure that the required rule is selected as a part of the filter.
For instance, clicking on ARGS:ip under Match Element, provides a preview exception option as shown below.
You could choose multiple field elements to create a more specific exception entry.
Accessing Recommendations
Prior to NSX Advanced Load Balancer version 21.1.3, recommendations were only based on the fact that a user decides that a given FLAGGED or REJECTED request is misclassified by WAF (a False Positive) and should not be FLAGGED or REJECTED in the future.
Starting with NSX Advanced Load Balancer version 21.1.3, system recommendations are introduced to help you ascertain and remediate false positives, if any.
Note: The system generates recommendations that suggest what you can do to mitigate a false positive. However, it is entirely within your discretion to decide if a log entry represents a false positive.
-
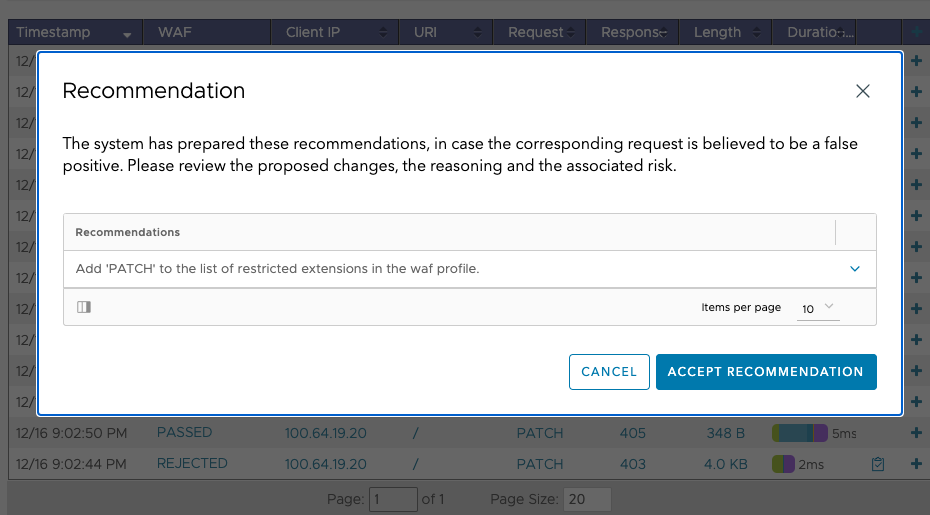
To view the recommendations, click the Recommendation icon corresponding to a FLAGGED or REJECTED log entry:
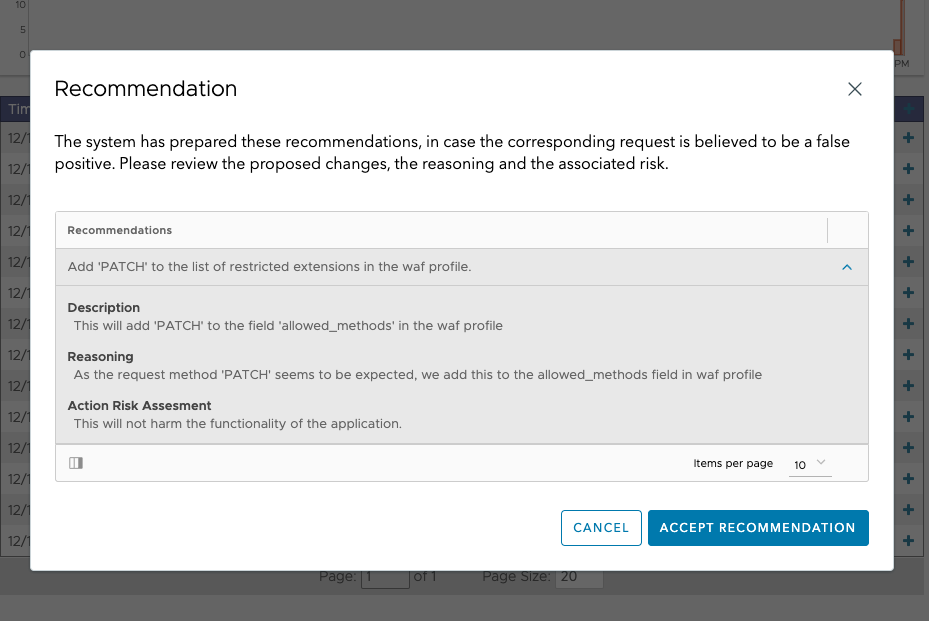
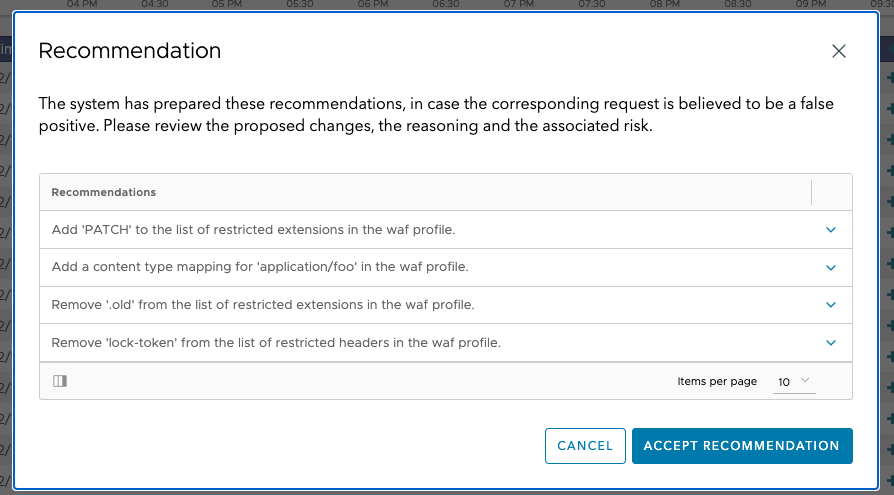
The Recommendation popup window appears one or more recommendations to remediate false positives, as shown below:
-
Review the proposed recommendations. Expand the recommendation to get more details. These details include a reasoning and a risk assessment for this change.
-
After reviewing the recommendation, if you decide that the log entry represents a false positive, click ACCEPT RECOMMENDATION to apply the change to the system configuration.
Notes
-
The system can recommend multiple changes at the same time. In this case, clicking Accept Recommendation will apply all of the recommendations to the active configuration.
-
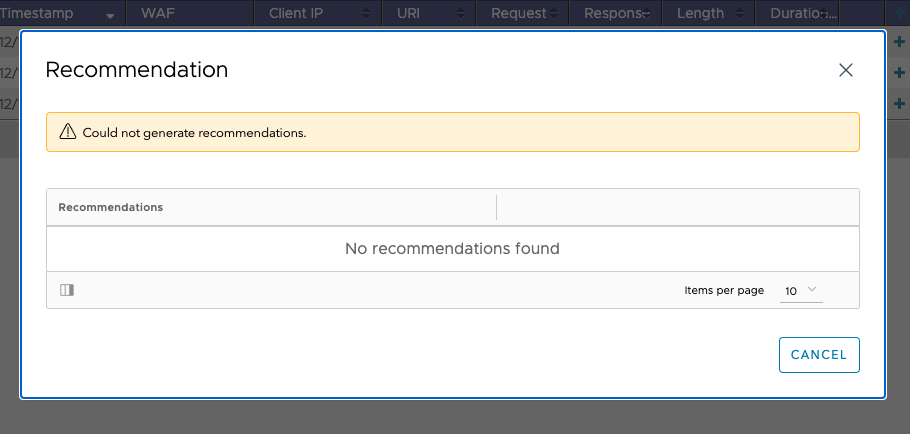
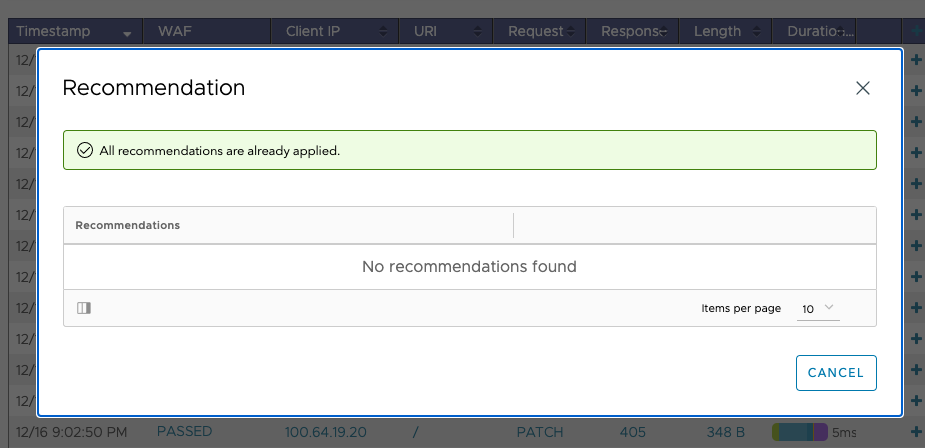
When everything the system can recommend is already applied to the configuration (for example, because you already applied this or another recommendation with a similar result), the following screen appear when the Recommendations icon is clicked:
-
The system is not able to generate a recommendation. In this case, you can still use the existing exception system.
In summary, you will find that, through this feature,:
- The system always handles the log entry. For example, you can get multiple recommendations for one log entry.
- More use cases are handled, for example, in the example shown above, adding a PATCH to a field in the WAF-Profile object is recommended.
Preview logs
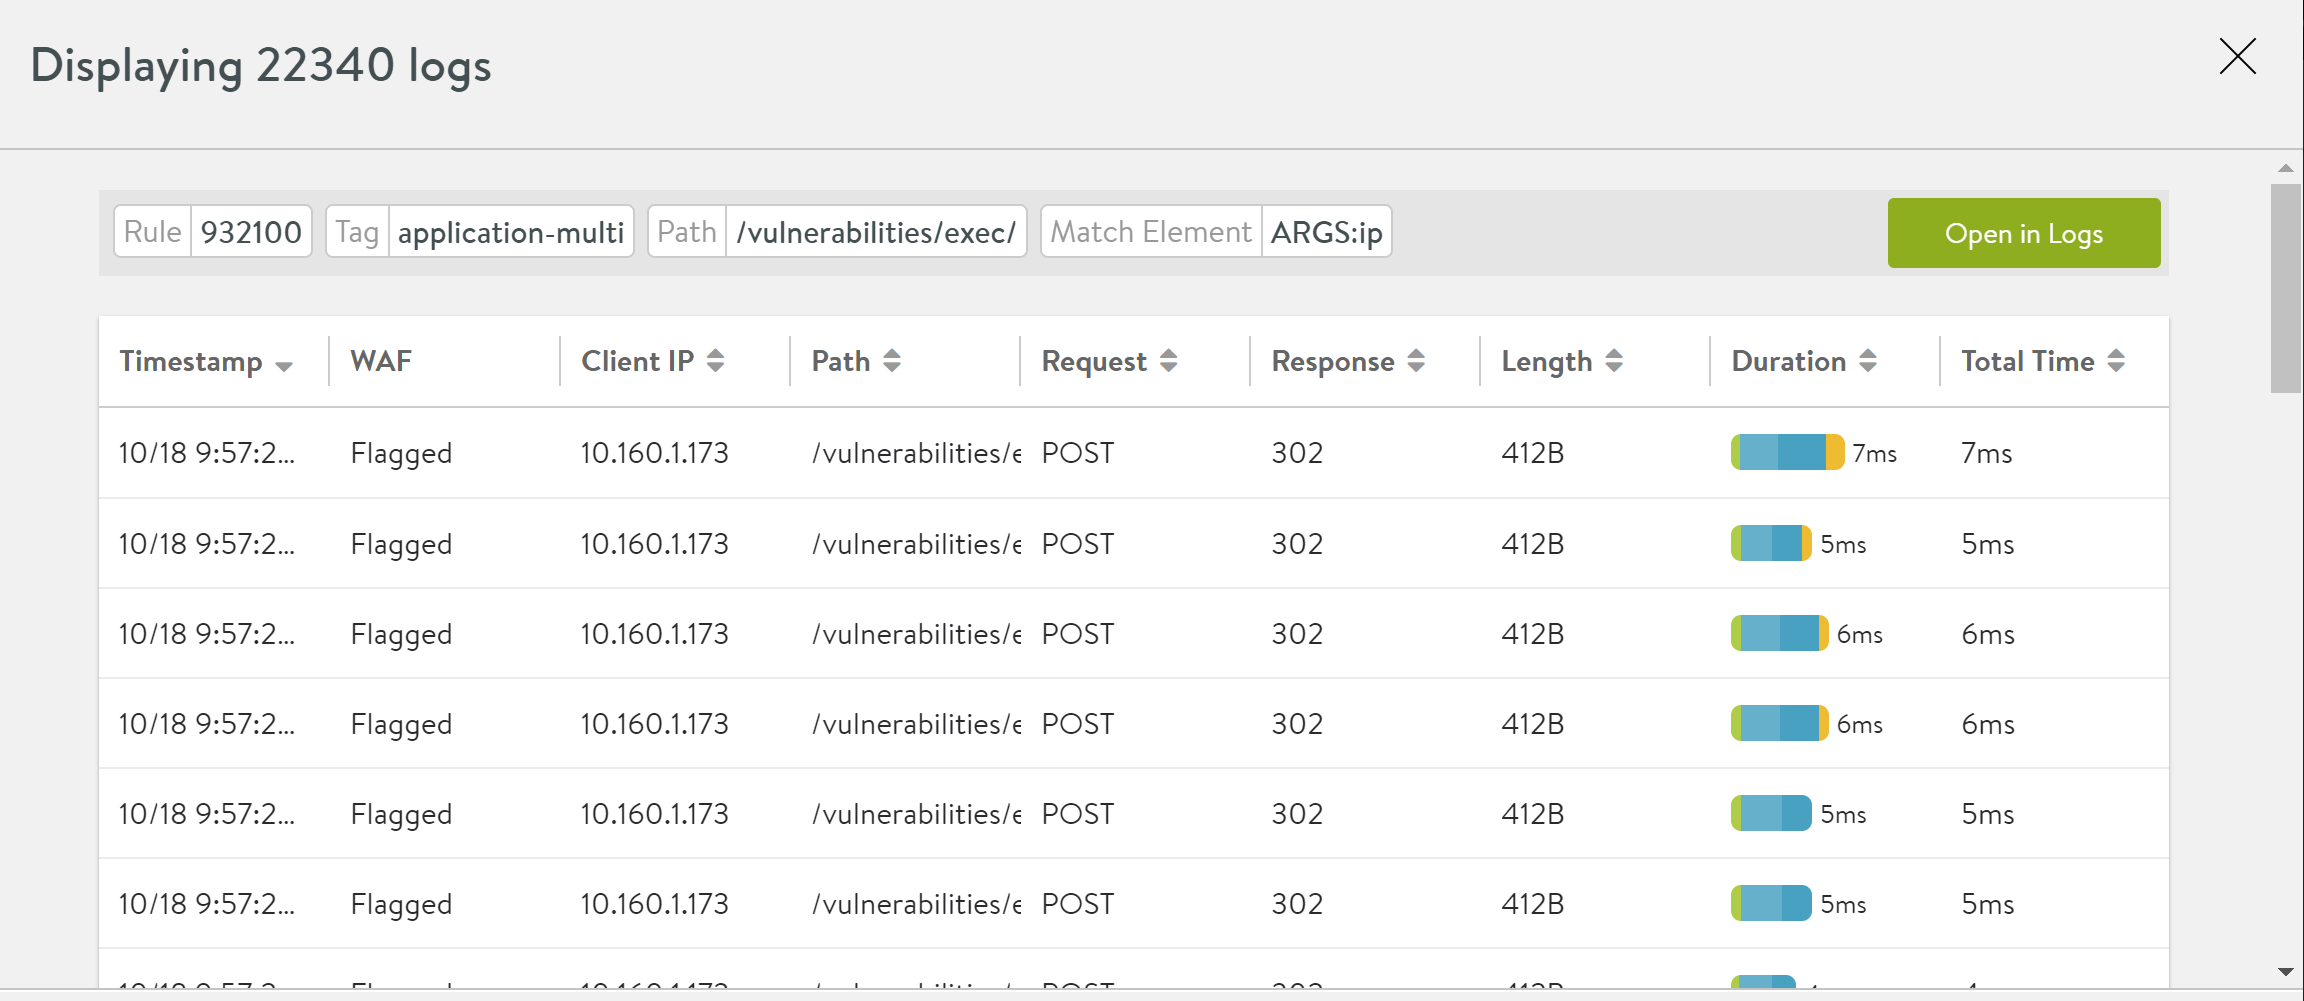
On choosing a specific filter, you could preview logs for that combination by clicking on the Preview Logs icon.
In the example below, the grayed out elements in the screenshot represent the filter elements chosen.
On clicking Preview logs, a log table as shown below will be displayed.

